
Air Quality Index (AQI) and You
During the 2018 Paradise Fire smoke wave, many in the Bay Area obsessively checked online for air quality information and updates. Here is an overview of a handful of real-time air quality websites I found helpful and how they compare. Keep in mind that climate change plus newer and cheaper monitoring equipment means that air quality information sources can change quickly. Air Quality Index (AQI) sites use a map to show the AQI number for an area. But what does this AQI number mean and why do different sites report different numbers?
Here is a short summary of the sites I used around the San Francisco Bay during the Paradise Fire.
Air Quality Info My top two choices for air quality: EPA airnow.gov and PurpleAir.com.
Runners up included Breezometer app and my native iphone weather app.
| EPA airnow.gov | PurpleAir.com |
 |
 |
| Pros: most widely used. High quality sensor (~$75,000 each)Cons: fewer sensors can misrepresent microclimates, refreshes every 2 hours. Site overwhelmed with web traffic during smoke wave.
AQI number tends to be lower |
Pros: Near instant readings, Many more sensors to show more detailed levels of air quality. Cons: Sensors not as accurate in higher concentrations (~$250 each). AQI number tends to be higher |
 |
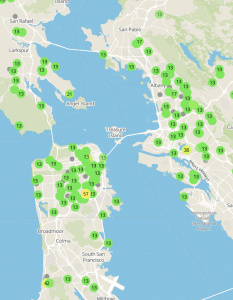 |
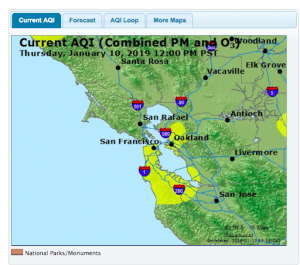
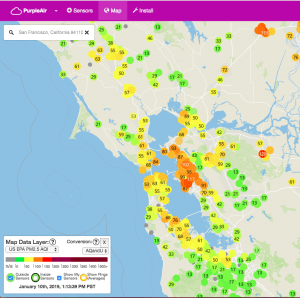
| EPA Airnow Fire Shows 2.5PM monitors for The Bay Area. Note only one for San Francisco | Purple Air Nearly 50 monitors in San Francisco |
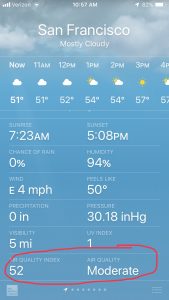
| iphone weather app | Breezometer app |
 |
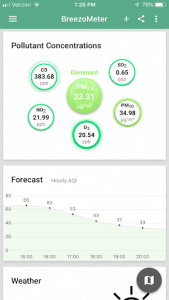 |
| Pros: Super easy to access.Cons: The source of this info has not been disclosed by Apple. I speculate it is based on EPA airnow.gov data. Slower to refresh than purpleair.com | Pros: Breezometer app is easy to use. One great feature is the ability to compare air quality at different saved locations. Shows 2.5PM counts in ug/m3.Cons: the app stopped working at times during the smoke wave. They developed their own version of AQI, so hard to compare numbers to other sites. |
FYI here are some other sites I used to track fire and smoke during the Paradise Fire:
Smoke and Fire Info
California Smoke Information Blog
California Wildfires traffic/fire Map
Smoke from Wildfires Map
San Francisco Dept of Emergency www.sf72.org
What is the Air Quality Index?
What is meant by AQI – Air Quality Index?
AQI is a color-coded, simplified index for reporting daily air quality. The EPA’s AQI index can help inform questions during smokey/smoggy days such as, “Should I keep my asthmatic child home from school?”, “Will the soccer game be canceled” or “Do I need to wear a mask?”
“It tells you how clean or polluted your air is, and what associated health effects might be a concern for you. The AQI focuses on health effects you may experience within a few hours or days after breathing polluted air. EPA calculates the AQI for five major air pollutants regulated by the Clean Air Act: ground-level ozone, particle pollution (also known as particulate matter), carbon monoxide, sulfur dioxide, and nitrogen dioxide.” source
What is Particulate Pollution – specifically 2.5 PM?
If the sky looks hazy, that is particle pollution, a mixture of solid particles and liquid droplets found in the air. Some particles are large enough to be seen with the naked eye; others are so small they are measured using an electron microscope. At Healthy Building Science we count 2.5 PM particulate pollution with our Lighthouse Laser Counter. These particles can be made up of hundreds of different chemicals.
 |
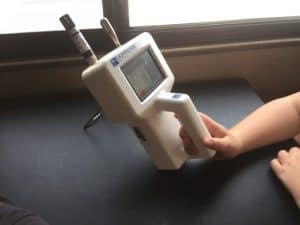 |
| Driving south in our RV, searching for cleaner air during the Paradise Fire. | Monitoring particulate air pollution on the road, with our Lighthouse Particle Counter during the Paradise Fire smoke wave. |
Fine particles (PM2.5) are very bad for your health, triggering or worsening chronic diseases such as asthma and heart attack, causing 4.2 million premature deaths worldwide per year in 2016. Read more from the World Health Organization. They are considered to be more harmful than larger particles because they penetrate the lung barrier to enter directly into the blood system. China recently lowered 2.5PM particle pollution in urban areas, residents are now expected to live 3.3 years longer! Source
All 2.5 particulate pollution is harmful to human health and smoke from burning buildings contains additional harmful pollutants compared to a forest fire. The AQI does not differentiate types of particulate pollution. The chemical makeup from wood smoke vs smoke from a burning car or hardware store can be significant. Smoke from burning buildings in Paradise, CA contained more harmful pollutants, such as flame retardants, plastics, and asbestos, than the smoke from the following forest fire. Weather Underground is recommending Purple Air monitors to track “deadliest type of air pollution”, 2.5PM particles.
 |
 |
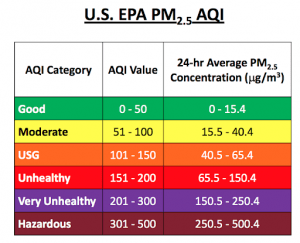
| If you really want to geek out on the numbers – here is a table comparing the AQI number to 2.5 PM counts. | At Healthy Building Science we have a number of gadgets to monitor 24-hr Average 2.5 PM concentration. |
Real-Time Air Quality Maps
On day 7 of the Paradise Fire, the San Francisco Unified school district canceled school as the AQI hit 235 – the PURPLE Very Unhealthy Level. BUT Purpleair.com was showing AQI in the 400’s.
 |
 |
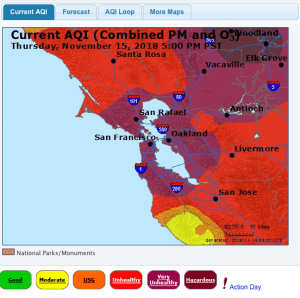
| November 15, 2018 airnow.gov | November 15, 2018 purpleair.com |
So why the difference in AQI numbers at airnow.gov and Purpleair? The most obvious difference is that the EPA’s AIQ number includes 5 major air pollutants whereas Purpleair is only monitoring 2.5PM particulate pollution. Both use proprietary algorithms to calculate/ average out their AIQ numbers. I found it best to use AIQ as a way to compare air quality over time and at different locations and I now resist the urge to narrow down to specific AIQ readings.
Northern Sonoma County Air Pollution Control District published a detailed guide and in depth comparison of airnow vs Purple air.
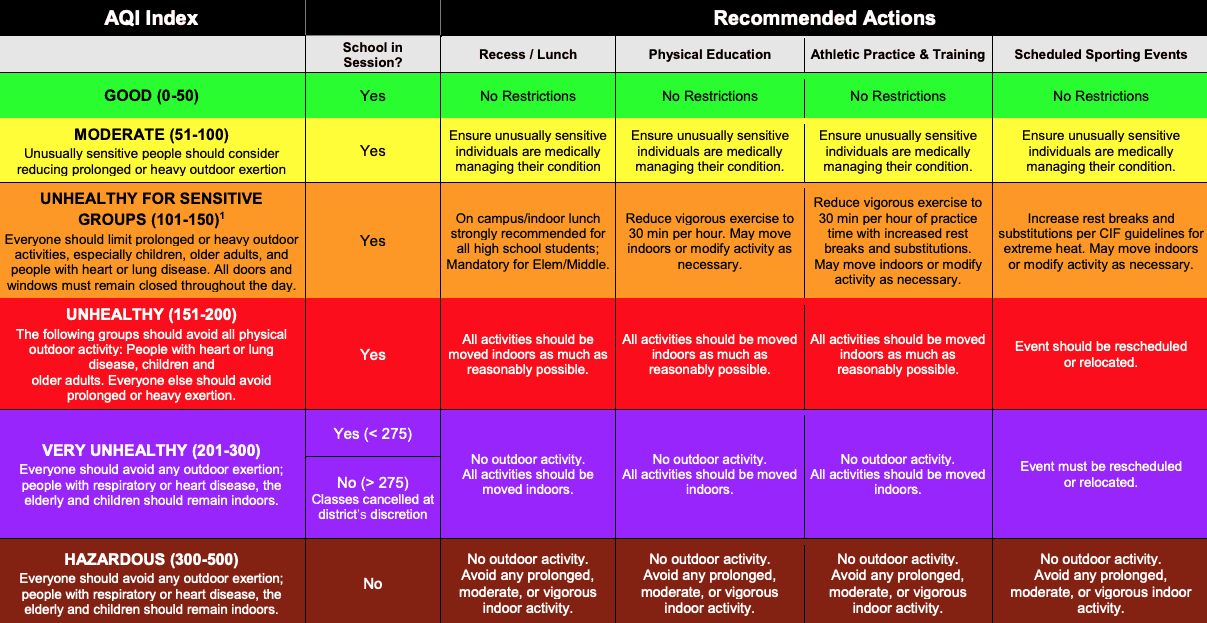
Stepping back from the numbers is all fine and good unless you are a decision maker for other people such as elementary school principals at Sonoma County School. They have been instructed:
- On days with questionable air quality, superintendents shall check purpleair.com at 5:00 am.
- If the Air Quality Index (AQI) is listed at 275 or above, districts may cancel classes.
This public school district chooses NOT to use the EPA airnow.gov and instead use Purpleair. This is a time of great change with climate chaos and affordable, emerging technologies.
- Great coverage of Sonoma County School’s decision on this wine country parent’s blog.
- Great overview of government vs private sources of air quality data at nytimes.com
Sonoma County School Air Quality Guidelines. source
I appreciate the Sonoma County Office of Education for taking a stand and publishing this guide. I plan to use it during future smoke waves.
Check out my blog on DIY Box Fan Filters.
Let’s wrap up this AQI ramble with the EPA’s Actions People Can Take to Reduce Particle Pollution:
- Conserve electricity
- Use dry, seasoned wood for fireplaces and stoves
- Carpool, use public transportation, bike, or walk when possible
- Avoid idling car engines for long periods of time
- Keep car tires properly inflated
- Maintain car, boat, and other engines to ensure maximum fuel efficiency
- Buy an electric car (I added this last one)
Written by Anne-Lise Breuning, Industrial Hygienist and Environmental Inspector for Healthy Building Science.
Healthy Building Science is an environmental consulting firm which provides indoor air quality testing services for commercial, multi-family buildings, offices, industrial and manufacturing workplaces, hospitals and medical facilities, and single-family homes in the greater San Francisco Bay Area and all of Northern California.
We would be pleased to become your go-to air quality consultant and help you with any of your air quality lab testing or air quality monitoring needs.
Please call 415-785-7986 or complete this online form today!


The environmental and health implications of climate change are profound. It’s so significant, it’s hard to get one’s mind around. In a larger context it’s a reminder that when you’re in a war you don’t really care too much about the foul smell in the air because you’re too busy dodging bullets. Presently we have the luxury of worrying about air quality and the taste and smell of our water, but perhaps in the not too distant future our entire society and way of living may be upended due to the rapidly changing climate. If your house is under water, or you can no longer purchase food at the grocery store, or democracy has shriveled and crime runs rampant – we’ll have other priorities to address. So, for now at least, I enjoy getting to worry about air quality and theorizing how climate change will indirectly impact human health.
The shift has coincided with rising temperatures and changing weather patterns, as a result of anthropogenic human-influenced climate change. Environmental scientists expect the number of burnt acres per year to continue to rise over the coming years, presenting a growing challenge for the Bay Area and its air quality. 3 Generally, air quality in San Francisco is at its best in the spring, as temperatures gradually warm and the forest undergrowth is still wet from the frequent rains of the winter months.